Measurement
How Leaders Should Use Data to Decide How to Act
One of the toughest jobs for organizational leaders is deciding how to act. You have complex systems to lead and improve—a mix
QOS: Activity 2 – Organization Viewed as a System
This is part of a series on Quality as an Organizational Strategy (QOS). Read the introduction or explore other activities: Activity 1
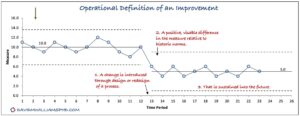
Operational Definition of Improvement
By David M. Williams, Ph.D. “What is YOUR definition of ‘improvement’?” she asked. The leadership team just finished reviewing the improvement efforts
Using Your Vector of Measures to Guide Action
By David M. Williams, Ph.D. Figure. Vector of Measures Displayed in Shewhart Charts (Source: QOS) One of the toughest struggles for leaders
Drilling Down into Aggregate Data
By David M. Williams, Ph.D. Every organization tracks a family of measures with data from various moments of time. The list of
Benchmarking – How do we compare?
By David M. Williams, Ph.D. No one likes to talk about dying. Sudden death due to heart disease occurs 250,000 times
Control Charts – What’s in a name?
by David M. Williams, Ph.D. Provost & Murray. (2010). Health Care Data Guide. Figure 14.18. P. 127 Have you taken one of
Tracking Project Progress
By David M. Williams, Ph.D. Improvement projects follow a trajectory from forming a team and chartering through achieving sustainable results. Whether leading
Is the I Chart the only Shewhart SPC chart I really need?
by David M. Williams, Ph.D. This is part of a series of blog posts on measurement for improvement. You can read them
What about qualitative data?
by David M. Williams, Ph.D. This is part of a series of blog posts on measurement for improvement. You can read them