Four PDSA Tests of Artificial Intelligence
 Photo by Hitesh Choudhary on Unsplash
I’m not an AI pioneer. On Everett Roger’s adoption curve, I’m somewhere between an early adopter and the early majority, and I’m wary of the hype. Axios described the future of AI as a tireless, ever-improving PhD assistant in your pocket. Others, however, see AI like the invention of fire: transformative, but with the potential to burn everything down.
In this era of rapid innovation, I look to practical people to help me understand AI. Dr. Ethan Mollick, a professor at the University of Pennsylvania’s Wharton School and author of Co-Intelligence, is one such person. He studies AI’s impact on work and education, and his advice is simple: ‘Remember, today’s AI is the worst AI you will ever use.’ He urges us to just try it and learn. AI is coming, so it’s up to us to discover its uses and limitations in real time. Here are four PDSA test of using AI chatbots in improvement work and what I learned.
PDSA 1 – Querying questions I thought I knew the answers to
My initial AI tests involved chatbots like ChatGPT, Google Gemini, or Claude. I approached them like a search engine, asking questions without providing context.
- Who created the Model for Improvement?
- What’s the difference between PDSA and PDCA?
- How are Shewhart Charts and Process Behavioral charts similar or different?
The answers were often incorrect, seemingly pulled from general internet scrapes rather than authoritative sources. For instance, they incorrectly attributed the Model for Improvement to the Institute for Healthcare Improvement, when it was developed by Associates in Process Improvement. Months later, when I re-ran the same queries, the answers were noticeably more precise and accurate.
PDSA 2- Adding prompts to develop a driver diagram for a change theory
I later discovered that chatbots require context, not just queries. It’s like briefing an AI assistant on your identity and their desired persona and their role before assigning a task. For example, I used this prompt to create a driver diagram for improving emergency department patient flow:
‘I’m trying to improve patient flow in the emergency department. I need you to help me find the research and best practices and develop a driver diagram. Focus on sources like peer-reviewed journal papers, white papers, and conference presentations. Attached is an example of a driver diagram for a healthcare improvement project.’
My first attempt last year yielded mixed results—a blend of evidence-based changes and internet ideas with questionable sourcing. The chatbot also couldn’t visually display the driver diagram.
Running the same query recently, the results were different. The chatbot first provided a synopsis, then a text outline of key drivers and change ideas for a theory of change, each with a source link. It also suggested a family of measures (outcome, process, and balancing). When I requested a visual display, referencing Bennett and Provost’s driver diagram paper as a benchmark, it generated a diagram (figure 1).
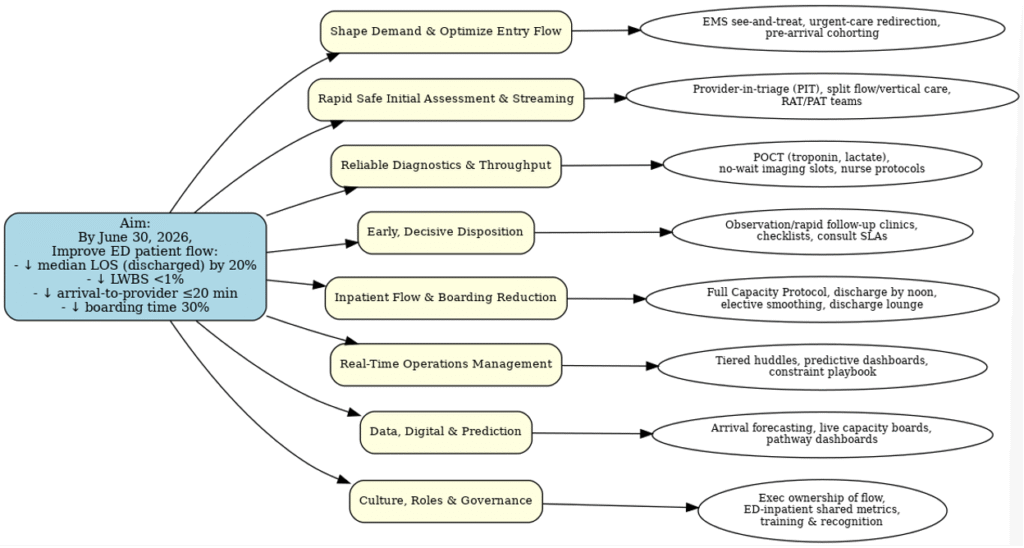
Figure 1. AI ChatBot generated a Driver Diagram for Improving Flow in the Emergency Department.
The text output was significantly better; an improvement advisor and subject matter expert could use it as a strong first draft. While the driver diagram resembled a basic mind-mapping app output, it was a good starting point.
PDSA 3 – Charting and interpreting data over time
Visualizing data over time with run and Shewhart charts is the gold standard in improvement. The inability to create these charts due to lack of knowledge or software can be a barrier to understanding variation. Can a chatbot assist? I’ve tested this repeatedly, and it consistently improves. I predict it will soon eliminate the need for specialized software.
Recently, I facilitated Deming’s Red Bead Experiment, collecting data (table 1) from six workers over four days.
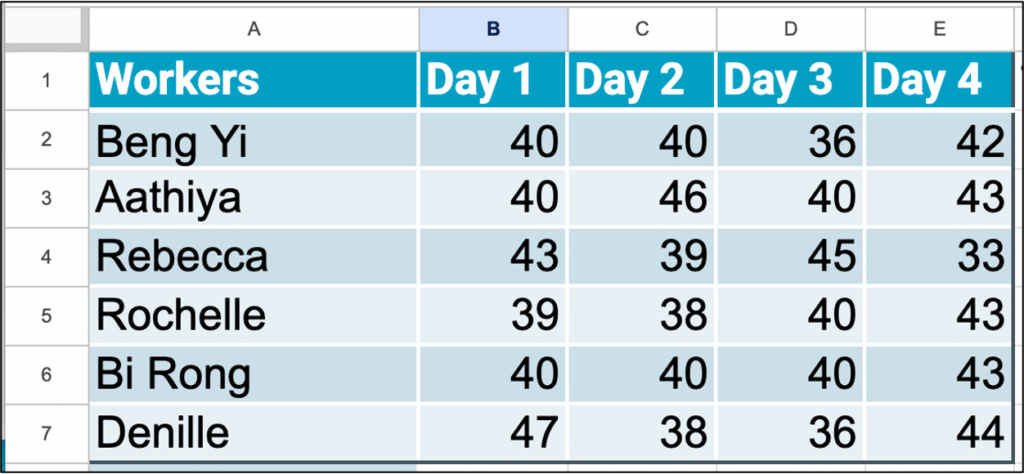
Table 1. Data table of white beads produced per day
I input this data into a chatbot with the prompt:
‘Here is data for a process where workers used a paddle with 50 holes to collect beads. A single bead fits in each hole. Each sample represents a day’s work and is a count of how many white beads they produced out of 50. This is the data for six workers and four days of work. Create a run chart showing each worker’s count of white beads in run order.’
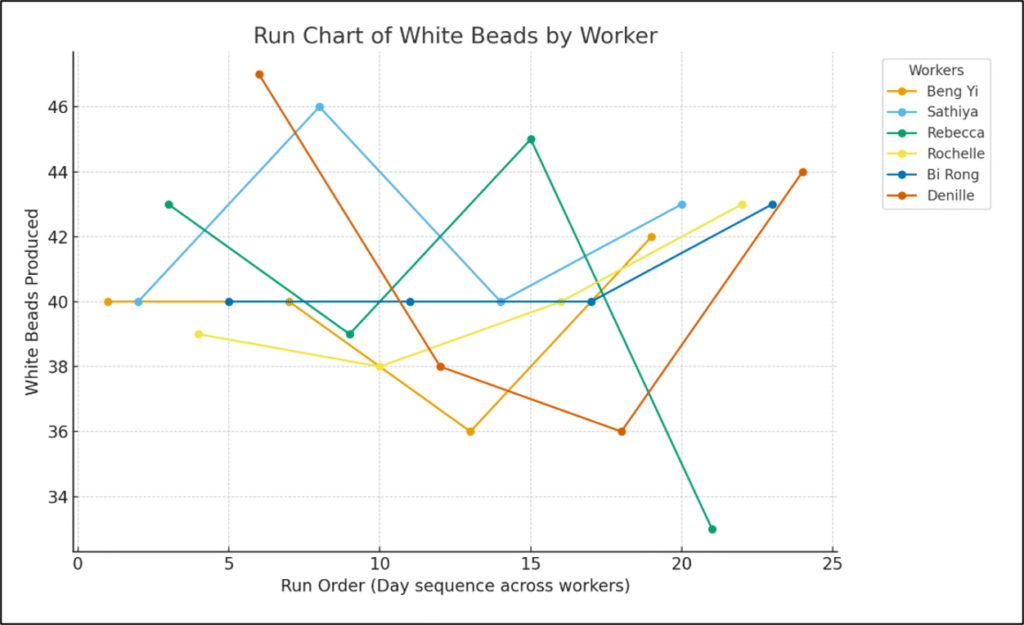
Figure 2. Chatbot’s first chart of data displayed in run order.
The chatbot produced an interesting chart (figure 2), with each line representing a worker’s white bead count over time. It took several iterations to refine the chart to display a single run order line with a median. Figure 3 is the final run chart (left) and the same run chart created in QI Macros.
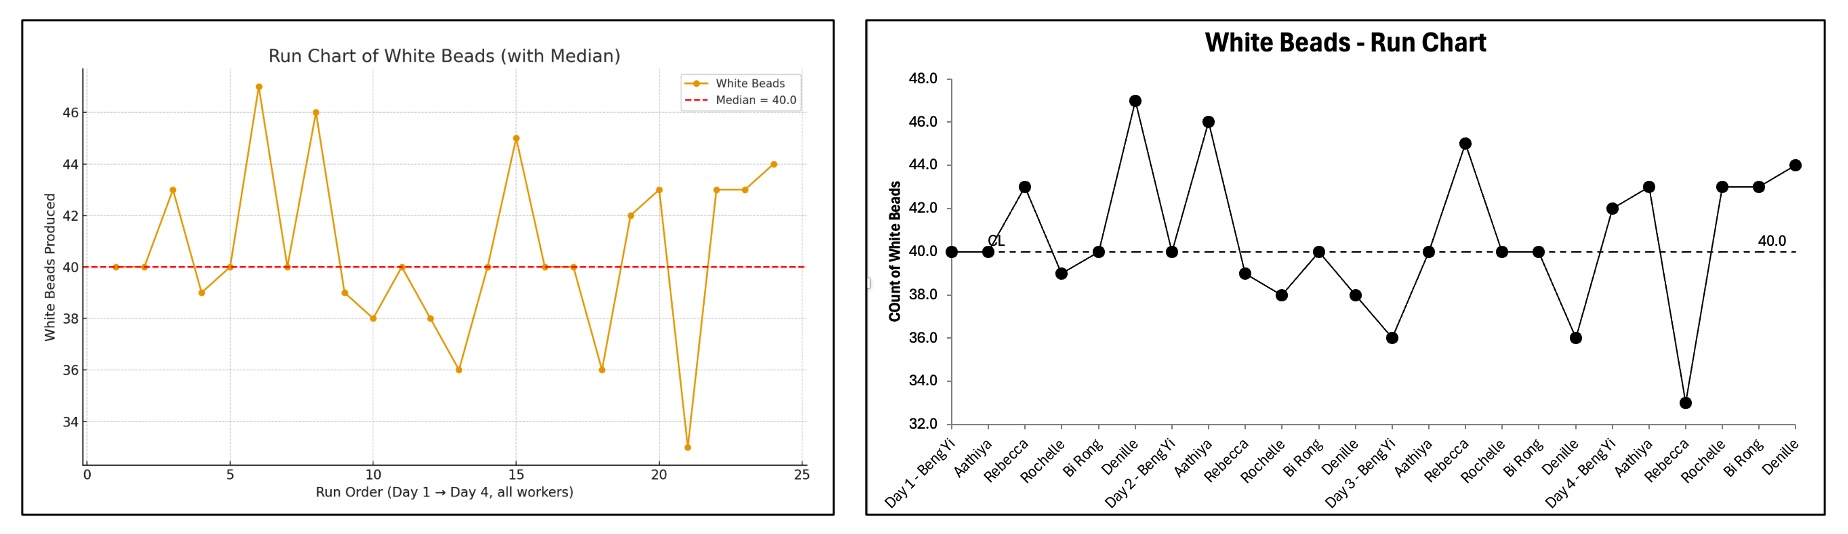
Figure 3. Left: Run chart by Chat Bot; Right: Run Chart in QI Macros.
I then requested a Shewhart chart, using the white bead count as the numerator and 50 beads (from the paddle with 50 holes) as the daily production. This data is suitable for a p-chart.

Figure 4. Left: Shewhart chart (p-chart) by Chatbot; Right: Shewhart chart (p-chart) in QI Macros
As demonstrated (figure 4), the chatbot successfully generated both run and Shewhart charts without additional software. While it wasn’t perfect on the first attempt, my prompting as a subject matter expert (though not best practice) helped. It took multiple iterations to achieve the final product, and further refinement would improve the display, but the chatbot delivered. Soon, chatbots may replace the need for dedicated software.
I also tasked the chatbot with reviewing the charts against run chart rules for signals and healthcare rules for special cause in Shewhart Charts, which it completed successfully.
PDSA 4 – Locating inputs for a natural experiment
While working with an Australian ambulance service, I aimed to demonstrate advanced PDSA and factorial design for an improvement leader. Lacking ambulance-specific examples, I wondered if a published study with documented changes and data existed. Sometimes, a natural experiment can be analyzed by inputting existing data into experimentation software. My attempts to find such a paper through various chatbot prompts were unsuccessful.
I won’t detail every iteration, but it was a learning experience. For instance, searching for papers including ‘factors’ (the term for changes in experiments) yielded many studies with the word, but not in the context I sought. After several rounds of clarifying instructions and reviewing recommendations, the chatbot eventually produced a study that seemed to match my criteria. However, there was no link. My searches on PubMed for the paper’s title and authors (who were real and had published on the topic) were fruitless. Even searching the journal issue turned up nothing.
The chatbot had hallucinated, merging topics, people, and journals into a convincing but nonexistent citation. This was my first encounter with an AI hallucination and a clear demonstration of that chatbot’s limitations at the time. I expect it’s improved since then.
Discussion
These four PDSA tests illustrate using an AI chatbot for improvement work. They are not meant as best practices or expert advice, but rather to embody Dr. Mollick’s encouragement to experiment with AI in real time. Test it in your work and personal life to discover its usefulness and limitations. This hands-on experience will reveal its potential and current utility.
While I’d like to claim greater proficiency, my progress is slow. Mastering chatbots takes practice, and the trial-and-error often feels like a hurdle to simply doing things the old-fashioned way. Yet, I’ve found it excels in areas where I’m slower. The output often feels like a 60-70% complete first draft; my iterations bring it to 80-90%, but I’m always the one to finalize it.
I worry some view chatbots as a substitute for thinking, rather than a partner. Many treat it as an ‘easy button’ for summaries or writing, with a mindset of ‘Why do the work if AI can?’ Their output often reflects this, resembling 60-70% effort.
Every chatbot has its strengths and weaknesses. I primarily use ChatGPT and Gemini, included with my Google Workspace. Others use Copilot, part of Microsoft Office. I suggest starting with what you have, then experimenting with other chatbots. New AI programs emerge daily; I can’t keep up, and I’m not sure I need to.
While I encourage experimenting with AI chatbots, be aware that organizations are grappling with their use and effectiveness. Many workplaces are developing policies, and journals have set guidelines for authors using AI. This piece was drafted the old fashioned way, but AI assisted with editing, and some figures were AI-generated.
Conclusion
AI is here, constantly improving with each use, and poised to be transformative. Use any available chatbot and experiment with it. Discover its utility in your improvement work. I now integrate this experimentation into all my teaching and advising. Remember Professor Mollick’s words: ‘today’s AI is the worst AI you will ever use.’ Keep trying, keep learning, and keep discovering how it can drive results-driven improvement.
David M. Williams, Ph.D. works with leaders and improvement teams to learn and apply Improvement Science to achieve results and adopt quality as a strategy, He is author of Quality as an Organizational Strategy: Building a System of Improvement.